Description
Drag the image to pan it around; use the mousewheel to zoom. You can also double-click the left and right mouse buttons to zoom.
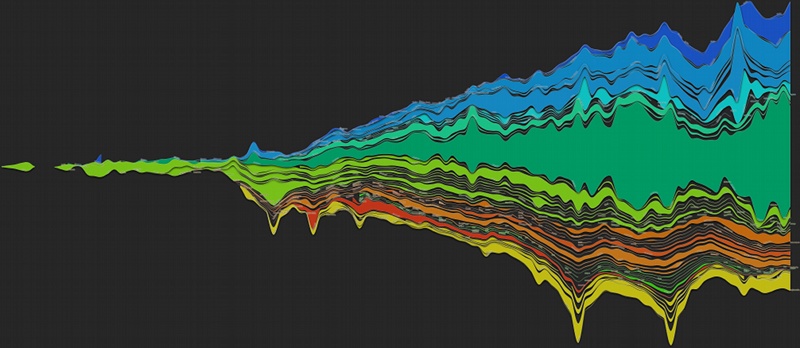
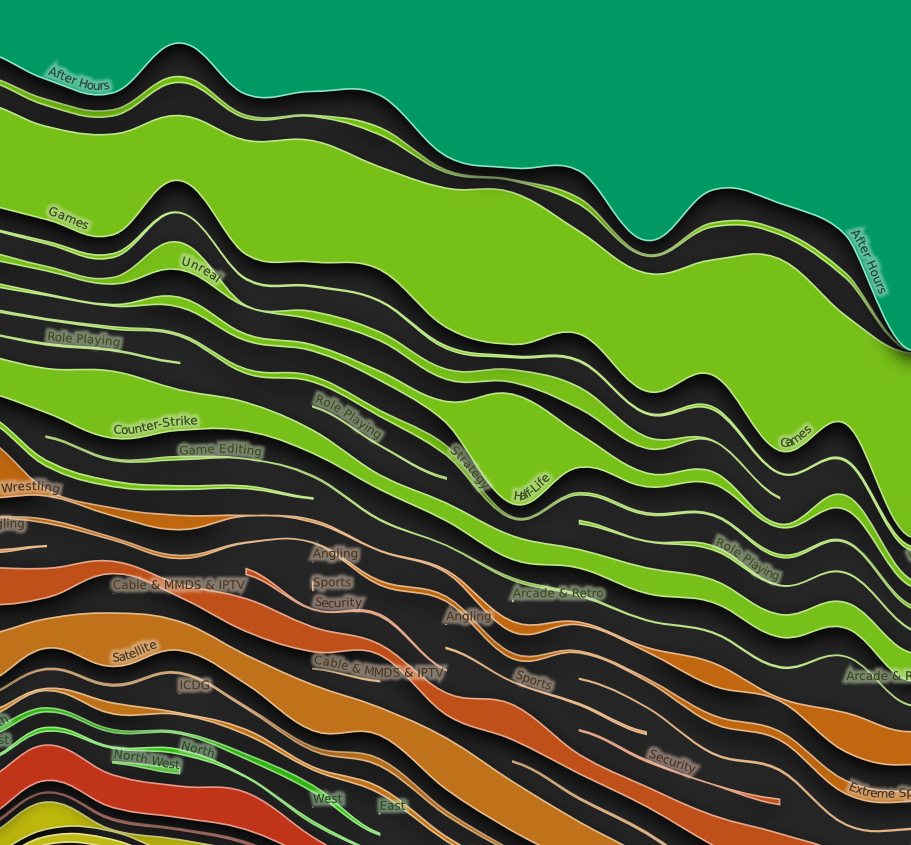
The image above is a stacked bar graph showing the popularity of the forums on the boards.ie bulletin board site. Each stripe is a forum on the site, and its height shows the number of posts in that forum over time.
For example, the thick green stripe in the middle shows the popularity of the 'After Hours' forum, which has been the most popular forum for several years.
The color groups correspond to the top-level forums. Rec forums are green; Soc forums are blue; etc.
When there are no new posts on a forum for a while, the stripe for that forum will end, but it can restart later. Along the top of the graph, you can see the comics forum doing this.
-
Data
The forum data visualized here is all available at http://boards.ie/, but it's very awkward to extract. As part of a contest, the board owners made the data available in RDF form. I processed the RDF data, especially the sioc:Thread nodes, to get the monthly forum post counts.
To cut down on the amount of data I had to process, I made the approximation that each thread's posts take place in the same month that the thread was created. There are certainly threads that last longer than a month, so there are times when a clump in the graph should be spread out over the next few months.
-
Tools and Technologies
- tabulator - examine the data in a browser
- cwm - transform and examine RDF documents in a shell
- rdflib - read, query, and write RDF in python
- pymunk - 2d vector library
- pygame - preview the relaxation step
- nevow.stan - create XML in python
- SVG - represent complex vector graphics
- inkscape - convert SVG to PNG
- Google Map Image Cutter - cut final image into multiple scale tiles for google maps
- google maps - display final image efficiently online
-
Findings
Most of the effort in this diagram went into making it automatically-generated and appealing, but despite that I learned a few things from this information display:1. boards.ie started as a place to talk about Quake
2. The 'After Hours' board is by far the most popular forum (in post count). You could learn that fact from the big forum list but you'd have to look through each toplevel section separately and sort the numbers yourself. And you still wouldn't know if After Hours is having a recent spike or if it's been like that for a long time.
3. The 'LAN Parties' forum used to be big in 2002-2003, but then it slowed down and even had some months with no new threads (in 2005).
-
Code
- ns.py - RDF namespaces used by the other modules
- forumTraffic.py - gathers sioc:Thread data from a directory of RDF/XML files and summarizes the post/month counts.
- forumTrafficReduce.py - combines forumTraffic result data into one document, summing results for the same forum that may have ended up in different forumTraffic jobs
- forumTiming.py - graph rendering
- relax.py - relaxation algorithm
-
Related
- RDF, the underlying technology that let me work on the boards.ie dataset
- SIOC, a way of talking about data like boards.ie using RDF
- Graph presentation
- ThemeRiver paper [pdf]
- Lee Byron's Stream Graph page
- NY Times box office graph project